Das Prinzip der Herstellung einer Si-reichen FeSiBCuNb weichmagnetischen Legierung durch Glühbehandlung
2023-05-18
Kategorie: Unternehmensnachrichten
Introduction
Amorphous and nanocrystalline soft magnetic alloys, as a new generation of energy-saving and environmentally friendly materials, have the advantages of low coercivity Hc, high permeability μ, good frequency characteristics, and high saturation magnetization Ms, which are widely used in power electronics fields such as inductors, magnetic amplifiers, and transformers. A typical composition Fe-Si-B-Cu-Nb (named as Finemet) was proposed by Yoshizawa, who pointed out that nano-grains with a size of about 10 nm are uniformly embedded in the amorphous matrix to form a two-phase composite structure. According to the theory of ferromagnetism, the magnetization mechanism of nanocrystalline materials mainly depends on the local magnetocrystalline anisotropy and ferromagnetic exchange interaction, which are closely related to the microstructure. Suzuki supposed that nanocrystals are randomly precipitated from the amorphous matrix after heat treatment, resulting in randomly oriented magnetic anisotropy. Meanwhile, the exchange coupling between different crystal grains induces the magnetic moment to be arranged in parallel, preventing the magnetization from proceeding along the easy magnetization direction of each crystal grain . The magnetocrystalline anisotropy K1 is averaged by multiple crystal grains, resulting in the low effective anisotropy <K>. Under this model, if the magnetization process is considered to be the uniform rotation process of spins, the permeability and coercivity of the material are only related to the <K>. Thus, when the grain size D is smaller than the ferromagnetic exchange length Lex, the grain refinement is conducive to achieving excellent soft magnetic properties.
Innovatively, grain refinement is closely related to the crystallization process for iron-based amorphous alloys, which mainly depends on the composition and heat treatment . As we all know, Cu element related to the nucleation of grains and Nb element corresponded to the growth of grains play a crucial role in the formation of Finemet nanocrystalline alloys. Previously, Hono et al. reported that Cu addition causes the fluctuations in the concentration of Fe atoms in the amorphous matrix promoting the formation of high-number-density of α-Fe nuclei, while Nb atoms increase the crystallization temperature of the area around the α-Fe crystal nuclei and hinder the coarsening of the crystal grains, which results in the formation of a fine nanocrystalline structure. In addition, since the formation of Cu clusters occur prior to crystallization and provide a new interface in the amorphous matrix, a suitable match between the (111) plane of the Cu clusters and the (110) plane of the Fe lattice decreases the interfacial energy and lowers the nucleation activation energy required for the precipitation of the α-Fe phase . Accordingly, we usually consider that high-number-density Cu-rich clusters are one of the important indicators for achieving denser, finer and uniform distribution of the α-Fe grains. However, the high non-magnetic Cu content inevitably leads to an overall decrease in Ms. Considering that the Cu and Fe atoms are frozen in the amorphous structure by rapid quenching, the size, density and distribution of Cu clusters are directly influenced by annealing. In order to avoid the limitation of high Cu content, the annealing process needs to be further optimized and explored to achieve a finely uniform microstructure.
In fact, the microstructure evolution of Finemet nanocrystalline alloys is not only related to the Cu content that utilizes the micro-scale segregation to promote the precipitation of the α-Fe nuclei , but also depends on the annealing treatment to eliminate the residual internal stress generated by the rapid solidification process. Due to the low solubility of Cu in Fe matrix, Cu atoms agglomerate to form clusters about 5 nm in size prior to crystallization, which facilitates the formation of nanocrystals. Sharma et. al reported that the two-steps annealing process tailors the microstructure related to the nucleation rate and growth rate, which achieves control of magnetic properties. Considering that the aggregation of Cu-rich atoms and precipitation of α-Fe(Si) phase are very sensitive to the annealing temperature , precise control of the parameters in the step annealing process is an effective method for achieving fine nanostructures. However, by adjusting the size, volume fraction and distribution of nano-grains during the entire annealing process, the influence mechanism of the step crystallization heat treatment on Cu clusters evolution and its soft magnetic properties is still unclear. In this paper, aiming to clarify the relationship between microstructural evolution and magnetic properties, we systematically investigated the crystallization mechanism, soft magnetic properties and frequency characteristics of the Si-rich Fe73.5Si15.5B7Cu1Nb3 amorphous alloy induced by annealing temperature.
1. Experimental details
Alloy ingot with a nominal chemical composition of Fe73.5Si15.5B7Cu1Nb3 (typical Finemet) was prepared by induction melting a mixture of industrial raw material 99.9 wt.% Fe, 99.98 wt.% Si, 99.8 wt.% Cu, pre-alloyed 65.9 wt.% Nb-Fe, and pre-alloyed Fe-17.6 wt.% B under an Ar atmosphere. Melt-spun ribbons with a width of about 10 mm and a thickness of about 23 μm were fabricated by single roller melt-spinning method in air. Then, the ribbon samples were wound into toroidal magnetic cores (dimension of Փ20mm×12mm×8mm) by simple electric winding machine. The annealed magnetic cores were carried out in a two-step process in a vacuum tube furnace. Firstly, the magnetic cores are heated to 480 ℃ for 15 min at a heating rate of 10 ℃/min under flowing nitrogen atmosphere to ensure that the cores temperature matches the furnace temperature due to radiation heat transfer. Subsequently, the samples continue to be heated to a specific annealing temperature (Ta~520 ℃-570 ℃) for 60 min at a heating rate of 1 ℃/min. The low heating rate promotes the consistency of the internal and external temperature of the magnetic cores, achieving a more uniform microstructure. Finally, the cores were naturally cooled to room temperature.
Microstructural evolution of as-quenched and annealed ribbon was characterized by X-ray diffraction (XRD, Bruker D8 Advance) with Co Kα1 radiation, high-resolution transmission electron (HRTEM) microscopy an energy disperse spectroscopy (EDS) and HAADF-STEM images (TEM, FEI Talos F200X). The samples used for TEM and HAADF-STEM observations were prepared by ion-milling method (Gatan 695). Thermal stability of the ribbon was evaluated by differential scanning calorimetry (DSC, NETZSCH 449 F3) at a heating rate of 10 ℃/min. The magnetic domain structures were observed by magneto-optic Kerr effect (MOKE, Evico) microscope, using the trans & pol mode with adjustable sensitivity direction along the air-bare surface of ribbon axis. The saturation magnetization Ms and coercivity Hc were measured using a vibrating sample magnetometer (VSM, PPMS-9) under the maximum applied field of 3000 Oe (≈240 kA/m) and a DC B-H loop tracer (Linkjoin MATS-2010SA) under an applied field of 80 A/m, respectively. The inductance (L) and impedance of the magnetic cores were measured by an impedance analyzer (Agilent 4294A) with an AC magnetic field of 0.6 A/m under one-turn coil.
2. Results and Discussion
Fig. 1(a) shows the XRD pattern of the Si-rich Fe73.5Si15.5B7Cu1Nb3 melt-spun ribbon taken from the free surface. The XRD pattern of the melt-spun ribbon exhibit only a broad diffuse diffraction peak at 2θ≈45° without any obvious crystallization peaks, indicating the formation of completely amorphous structure. For further structural analysis, the transmission electron microscopy (TEM) was carried out. It can be clearly observed that there is no obvious phase contrast in the Fig. 1(b), and the corresponding selected-area electron diffraction (SAED) pattern shows diffused rings without any spots (Fig. 1(c)), indicating the classic diffraction characteristics of the amorphous state with long-range disordered structure, which is consistent with the XRD results. As shown in Fig. 1(d), the DSC curve of the melt-spun Fe73.5Si15.5B7Cu1Nb3 amorphous ribbon at a heating rate of 10 ℃/min is conducted. Two distinct exothermic peaks are found in the curve, indicating that the crystallization behavior of the amorphous alloy is a transition process from a high-energy metastable amorphous phase to a low-energy steady-state crystallization phase. According to the former reports, the onset temperatures of the two peaks represent the precipitation of α-Fe(Si) phase and the crystallization of the remaining amorphous phase associated with Fe-(B, P) secondary compounds, respectively. It is worth noting that the Si-rich sample shows a large temperature difference ∆T (=Tx2-Tx1) over 170 ℃, suggesting a good thermal ability, which means that there is a larger crystallization space to optimize the crystallization microstructure and stabilize the remaining amorphous phase to achieve single, uniform, and fine α-Fe phase without any compounds.
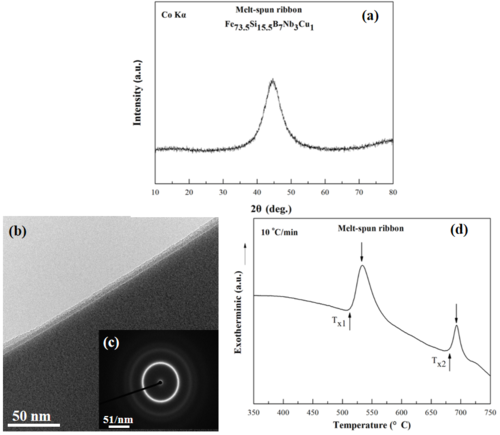
Fig. 1. (a) X-ray diffraction pattern, (b) typical TEM bright-field image, (c) the corresponding selected area electron diffraction (SAED) pattern, and (d) DSC curve for the melt-spun Fe73.5Si15.5B7Cu1Nb3 alloy ribbon.
Then, the microstructure evolution of the sample after a series of annealing at 520 to 570 ℃ is systematically investigated. The XRD patterns of the annealed ribbon by a two-step process are shown in Fig. 2(a). When annealed at a lower temperature (~520 ℃ near Tx1), some low-intensity sharp peaks are detected, indicating that the sample starts to crystallize and a small amount of α-Fe(Si) phase precipitates from the amorphous matrix. Evidently, the intensity of the peaks, especially in 2θ≈45°, 65°, and 82°, gradually increases with increasing annealing temperature Ta, which leads to high volume fraction of the crystalline phase. It is noted that only a single α-Fe(Si) phase exists in the amorphous matrix during the annealing process, forming a dual-phase structure with coexistence of amorphous matrix phase and nanocrystalline phase. As a result, the microstructure of annealed ribbon is only influenced by the grain size and the volume fraction of the α-Fe(Si) phase, which directly depends on the nucleation, precipitation and growth process. Accordingly, the bright-field TEM images, the corresponding SAED patterns and the distribution of the average grain sizes for the typical annealed ribbon were further observed. Apparently, the amorphous region after annealing at this typical temperature is almost invisible, meaning the completely precipitation of the α-Fe(Si) grains. As shown in Fig. 2(b)-(c), when the sample is annealed at 560 ℃, a higher volume fraction and finer nano-grains are uniformly distributed in the amorphous matrix, which can be identified as the α-Fe(Si) phase corresponding to the (110), (200), (211), and (220) planes in the patterns (Fig. 2(b1)), which is similar to the ribbon annealed at 570 ℃ (Fig. 2(d)-(e)). The difference is that the higher Ta induces the excessive growth of α-Fe(Si) grains and causes a larger average grain size of approximately 14.2 nm (Fig. 2(d2)), which results in coarsening of the nanostructures. Especially, compared with the ribbon annealed at a higher Ta, the sample annealed at 560 ℃ exhibits a more uniform microstructure with much narrower grain distribution from 7 to 17 nm (Fig. 2(b2)), thereby achieving the refinement and homogenization of nanostructures.

Fig. 2. Microstructure evolution of the Fe73.5Si15.5B7Cu1Nb3 alloy ribbon annealed at various temperatures by a two-step annealing process. (a) XRD patterns, (b)-(c) Bright-field TEM images: (b1) the corresponding SAED patterns and (b2) grain size distributions annealed at 560 ℃, (d)-(e) Bright-field TEM images: (d1) the corresponding SAED patterns and (d2) grain size distributions annealed at 570 ℃.
Fig. 3 shows the high-angle annular dark-field scanning TEM (HADDF-STEM) and element mapping images of the Si-rich Fe73.5Si15.5B7Cu1Nb3 alloy ribbon annealed at 560 ℃ and 570 ℃. Low content of light element B is hard detected by the HADDF-STEM. The distribution of the relevant elements in the sample annealed at 560 ℃ seems to be similar to that of the sample annealed at 570 ℃. Due to the low solubility of Cu in the Fe unit cell, Cu-rich clusters formed by a large number of Cu atoms precipitate from the amorphous matrix and segregate in the Fe-rich areas. The annealed samples show the uniform distribution corresponded to the Si element and Nb element (Fig. 3d1-e1 and d2-e2) and the local inhomogeneity associated with the Fe enrichment zone and deficiency zone. As can be seen from the Fig. 3(c), there are significant concentration differences in the circles suggesting the Fe-rich areas, which corresponds to the location of the nanocrystalline grains determined from the HADDF-STEM images (Fig. 3a1 and a2). Interestingly, the Fe-deficient zones seem to be occupied by Cu clusters, while Fe element surrounds the Cu clusters to form the enrichment zones of Fe, which suggests that the Cu clusters remain at the α-Fe(Si)/amorphous interface and directly contact with the α-Fe(Si) grains. This phenomenon is consistent with the typical theory of nanocrystallization for Finemet alloy reported by Hono et. al [18], who pointed out that the enrichment of Cu causes fluctuations in the concentration of Fe atoms between Cu-rich clusters, resulting in the local inhomogeneity of the high percentage Fe elements. Actually, this fluctuation creates more nucleation sites for the precipitation of α-Fe(Si) phase, which contributes to a more uniform dual-phase nanostructure with the coexistence of nanocrystalline phase and amorphous matrix.
Also, we know that the formation of nanocrystalline structure could be ascribed to the Cu clusters in the amorphous matrix. For a comprehensive understanding of the morphology of Cu clusters in the amorphous matrix, the bright-field TEM images, SAED patterns, high resolution TEM image and the corresponding energy dispersive X-ray profiles of the alloy annealed at 560 ℃ were detected and shown in Fig. 4. The microstructure of the annealed sample only consists of the α-Fe(Si) phase, the remaining amorphous matrix phase and Cu clusters. As we can see, the Cu clusters seem to be surrounded by α-Fe(Si) grains in the Fig. 4(a) and (b). Also, the clusters with a grain size of about 10 nm (Fig. 4c) and an FCC structure (Fig. 4d) are embedded on the amorphous matrix, which are similar to the nucleation of α-Fe(Si) grains occurring on Cu clusters. The EDX analytical data shown in Fig 4(e)-(g) obtained from the FCC Cu cluster, the remaining amorphous matrix, and BCC α-Fe(Si) phase, respectively, demonstrates that the Cu clusters provide nucleation sites in the amorphous matrix for precipitation and growth of the α-Fe(Si) grains. According to the theory of heterogeneous nucleation [30], a suitable match between the (111) plane of FCC-Cu cluster and the (110) plane of BCC-Fe lattice decreases the interfacial energy and the total free energy for the precipitation of α-Fe(Si) grains. Simultaneously, due to the large positive mixing enthalpy between Cu and Fe elements, Fe atoms are rejected from the Cu-rich regions and accumulate at the Cu/amorphous interface, which promote the nucleation of α-Fe(Si) grains on the Cu-rich regions or at the interface of Cu-clusters/amorphous, thereby inducing heterogeneous nucleation. Combined with the Fig. 3, we can deduce that Cu clusters play a key role in the formation of the nanocrystalline grains, which not only cause fluctuations in the Fe element concentration between Cu clusters, but also act as nucleation sites for the α-Fe(Si) grains to facilitate heterogeneous nucleation. Therefore, the results indicate that the nanocrystallization mechanism of the Finemet amorphous alloys could be ascribed to the mutual effect of element concentration fluctuations and heterogeneous nucleation.
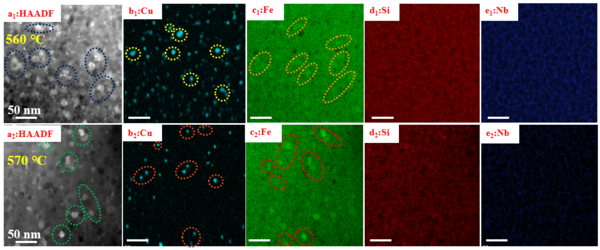
Fig. 3. HAADF-STEM (a1, a2) and Cu, Fe, Si, Nb element mapping (b1-e1, b2-e2) images of the Si-rich Fe73.5Si15.5B7Cu1Nb3 alloy ribbon annealed at the typical temperatures: (a1-e1) Ta~560 ℃, (a2-e2) Ta~570 ℃.

Fig. 4. Microstructure of the Fe73.5Si15.5B7Cu1Nb3 alloy after annealing at 560 ℃. (a) Bright-field TEM images; (b) HRTEM image of the enlarged view in the box; (c) Enlarged view of the region A as indicated in (b) with the (d) FFT pattern; (e)-(g) EDX spectroscopic profiles taken from (b) the region A, region B, and region C, respectively.
In addition, the annealing process not only affects the microstructure, but also induces the evolution of the magnetic domain structure closely related to the magnetic properties. Fig. 5 shows the variation of magnetic domain structures for the Fe73.5Si15.5B7Cu1Nb3 alloy ribbon after annealing at 520 to 570 ℃ under zero field. When annealed below 540 ℃, the domain patterns of the samples exhibit the regular stripe magnetic domain shapes with preferred orientation. As shown in Fig. 5(a) and (b), the domain walls present a straight line shape with 180° walls, and the distance between adjacent domain wall is relatively uniform and small, which indicates that the sample has a uniformly distributed magnetic domain structure. Also, it can be seen from Fig. 5(c) that the temperature-induced magnetic domain wall movement increases the width of the magnetic domain and forms the parallel zigzag-like domains with high density of branches, showing the higher pinning effects. After annealing at 560 ℃, the magnetic structure of the sample changes from a high-density multi-stripe domains of about 3 μm to broadened stripe domains over 50 μm with several pinning sites (in Fig. 5(d)), which is considered that the change of domain structures after annealing is directly related to the inter stress. Interestingly, the pinning sites disappears with further increasing annealing temperature, and only two wide and straight regular stripe domains with alternating bright and dark are observed in Fig. 5(e), suggesting a decrease in pinning effect and low domain wall energy. It is worth noting that the formation of magnetic domains is the inevitable result of various energies in the magnets, including exchange energy, demagnetization, magnetocrystalline anisotropy, and domain wall energy, which follows the principle of lowest energy. Among them, the extremely low demagnetizing field energy is the root reason for the formation of magnetic domains, which promotes the magnet to be divided into a large number of small domains. Actually, due to the inconsistent orientation of the magnetic moments in the magnetic domain walls, the enhancement of domain wall energy caused by multiple magnetic domains increases the exchange energy and magnetocrystalline anisotropy, which has an impact on the magnetic properties. Hence, we can conclude that the annealing temperature induced the evolution of magnetic structure balances the demagnetizing field energy and the domain wall energy and decreases the pinning effects, which results in low magnetic anisotropy and effectively controls the magnetic domains, thereby achieving more excellent comprehensive soft magnetic properties.
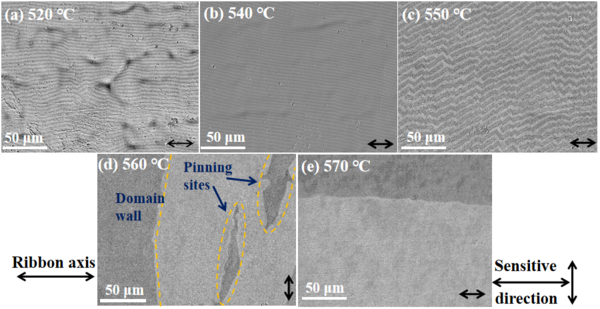
Fig. 5. Magnetic domain structures of the Fe73.5Si15.5B7Cu1Nb3 alloy ribbon annealed at (a) 520 ℃, (b) 540 ℃, (c) 550 ℃, (d) 560 ℃, and (e) 570 ℃.
For the further consideration of the relationship between properties, microstructure, and magnetic structure evolution, the static and dynamic magnetic properties of the annealed sample are detected. Fig. 6(a) shows the typical hysteresis loops of the Fe73.5Si15.5B7Cu1Nb3 nanocrystalline alloy annealed at 520 to 570 ℃. As enlarged in inset (b), there is no obvious change in the loops of the sample at different annealing temperatures, and its Ms varies between 124.8 and 135.9 emu/g. Also, the Ms of the ribbon increases with increasing annealing temperature, and then remains constant at 560 ℃. For nanocrystalline alloys, the Ms of the alloy is proportional to the Fe content, which is closely related to the volume fraction of the amorphous phase (Vam) and the nanocrystalline phase (Vcr). The Ms can be expressed as the following equation:
 (1)
(1)
where Mscr and Msam are the saturation magnetization of the crystalline and amorphous phases, respectively. Also, the intercrystalline amorphous phase exhibits a lower Ms of about 1.5 T due to the large amount of non-metallic elements, which is much lower than that of the α-Fe(Si) phase [31]. According to the Fig. 2(a), a large amount of α-Fe nanocrystals precipitate from the amorphous matrix induced by annealing at high temperature, which greatly increases the volume fraction of the α-Fe(Si) phase. High number density of nanophase promotes the strong exchange coupling between α-Fe(Si) grains, thereby leading to an increase in Ms. However, when the annealing temperature rises to 570 ℃, high-temperature annealing causes excessive growth of the α-Fe(Si) phase, resulting in the non-uniform microstructure, which is consistent with Fig. 2(d)-(e). The coarsening of the crystal grains decreases the exchange coupling between the crystals, which deteriorates the magnetic properties.
Fig. 7(a) shows the variation of coercivity (Hc) as a function of annealing temperature for the Si-rich Fe73.5Si15.5B7Cu1Nb3 nanocrystalline alloy, whereas the inset (b) presents the typical hysteresis loops at certain annealing temperatures. The alloy after annealing at a lower temperature exhibits extremely low Hc ranging from 520 to 560 ℃, and a decrease in Hc from 0.88 to 0.56 A/m was observed. However, the higher temperature annealing induces the deterioration of the magnetic properties for the ribbon, and the Hc increases to 2.73 A/m with further increasing in annealing temperature. Also, the high-temperature annealing changes the shape of the hysteresis loops, which achieves a low remanence. Generally, the Hc is not only related to the chemical composition of the material, but also depends on the grain size, volume fraction and uniformity of the nanocrystalline phase mainly affected by the annealing process. Obviously, the optimal annealing temperature promotes the formation of uniform and fine microstructure, which is conducive to achieving excellent soft magnetic properties.

Fig. 6. (a) Hysteresis loops and (b) inset of the saturation magnetization Ms as a function of annealing temperature Ta for Fe73.5Si15.5B7Cu1Nb3 alloy ribbon.
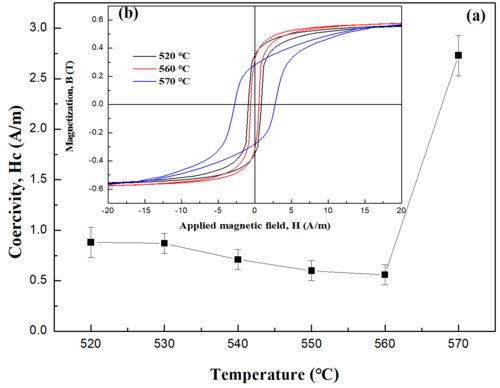
Fig. 7. (a) Coercivity Hc and (b) M-H hysteresis loops as a function of annealing temperature Ta for the Fe73.5Si15.5B7Cu1Nb3 alloy ribbon.
The inductance coefficient is considered to be one of the important indicators to measure the magnetic properties of materials, especially in high frequency, which plays a role in filtering and noise reduction. Fig. 8(a) displays the change of inductance (L) with frequency from 1 kHz to 1 MHz at different annealing temperatures. All the annealed samples exhibit a similar trend, that is, L is inversely proportional to frequency. As shown in the Fig. 8(b), there are three distinct special regions in the variation of L induced by annealing temperature, which are divided into low, medium, and high frequencies. In the low frequency range below 20 kHz, the L first gradually increases with an increase in annealing temperature up to 560 ℃, and then decreases rapidly on annealing up to 570 ℃. Interestingly, the L of the sample annealed at 550 ℃ decreases slowly in the frequency range of about 20-60 kHz, while the sample annealed at 570 ℃ exhibits higher L values above 60 kHz. It is well accepted that the external magnetic properties of nanocrystalline soft magnetic materials, such as L and Hc, are a function of the magnetocrystalline anisotropy, which mainly depend on the microstructure. According to the random anisotropy model [10], different from the magnetization mechanism of traditional soft magnetic materials, the strong ferromagnetic coupling between nano-scale grains together with the random orientation of multiple magnetic average the magnetocrystalline anisotropy of a single crystal grain to form a small effective magnetic anisotropy constant, which is the fundamental reason for achieving excellent soft magnetic properties. During low temperature annealing induced crystallization, the low volume fraction of the nanocrystalline phase causes a larger intergranular spacing to reduce the exchange coupling between the crystal grains, that is, the amorphous matrix induced weakening effect. Meanwhile, the internal stress existing at the interface between the precipitated nanocrystalline grains and the amorphous matrix leads to a large magnetic anisotropy energy, which causes high Hc and low L. Increasing in annealing temperature promotes the formation of nanocrystalline structure with high-density, fine and uniformly distribution of α-Fe grains, which contributions to the excellent soft magnetic properties. Considering the correlation between soft magnetic properties and grain size, high-temperature annealing induced grains coarsening leads to an increase in Hc and a decrease in L. It is worth noting that the anisotropy introduced by grain coarsening restrict the movement and rotation of domain walls, which affects high-frequency characteristics. As a result, the adjustment of annealing process introduces appropriate anisotropy to control the inductance and hysteresis loops, which effectively improves the high-frequency characteristics, thereby providing guidance for the applications of nanocrystalline soft magnetic alloys at different frequencies.
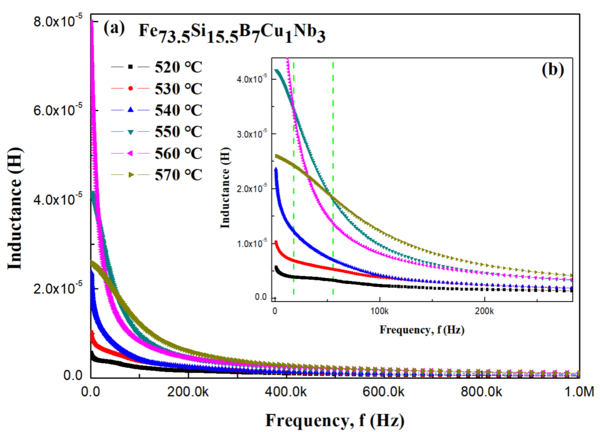
Fig. 8. (a) Variation of inductance (L) with annealing temperature in the frequency range of 1 kHz to 1 MHz for the Fe73.5Si15.5B7Cu1Nb3 alloy ribbon. (b) Inset of the partial amplified L in certain frequency ranges.
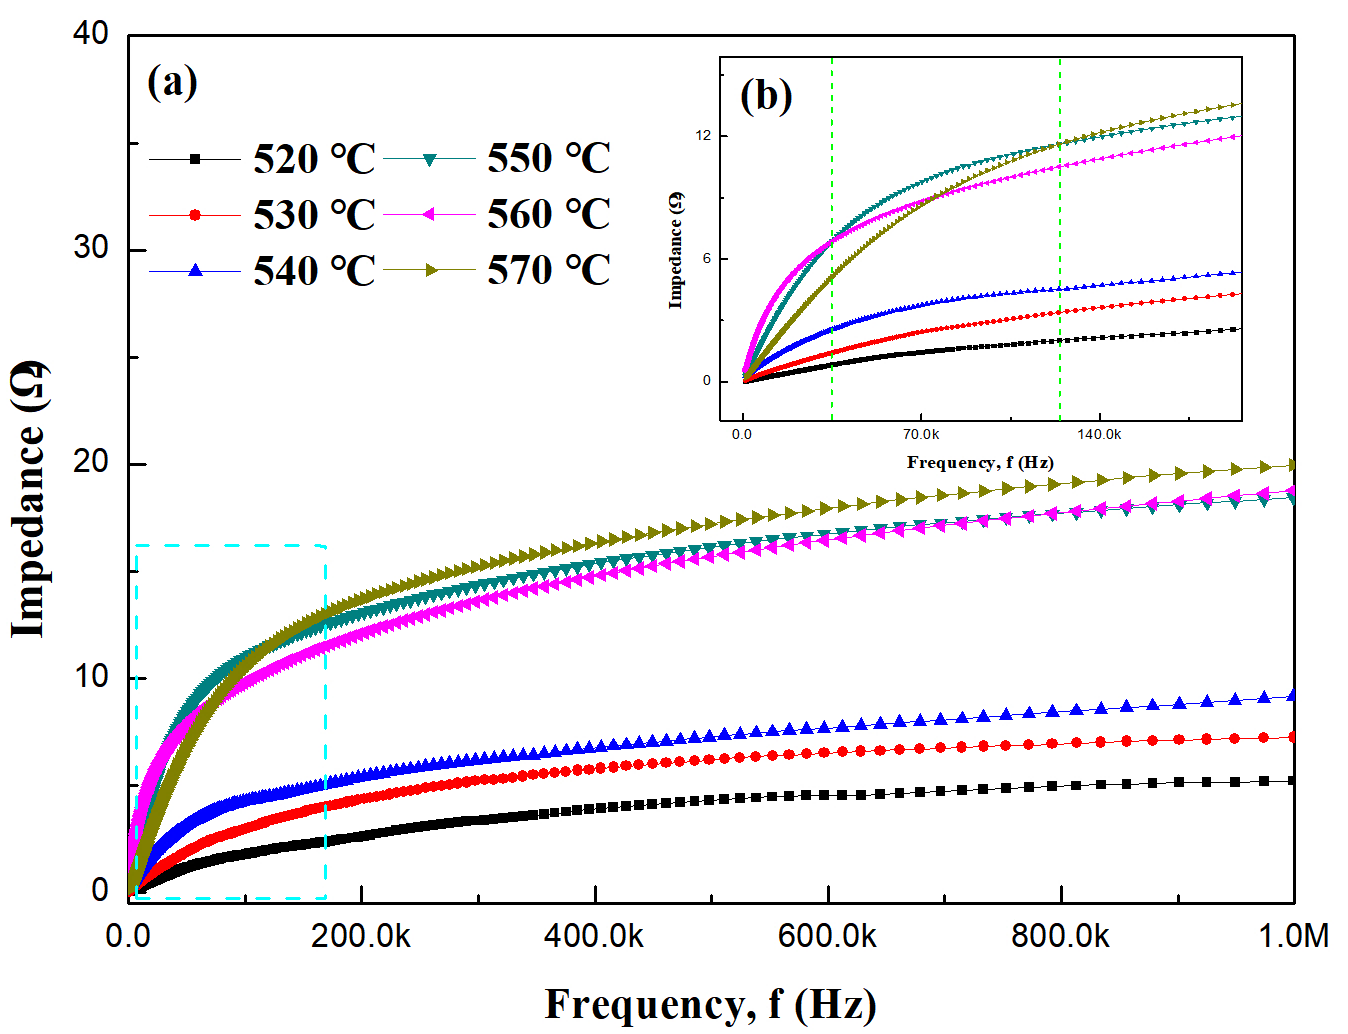
Fig. 9(a) shows the impedance (Z) of the samples annealed at various temperatures as a function of frequency. It is clear that the variation trend of Z is consistent with change of L for the annealed ribbons. As shown in Fig. 9(b), under a frequency below 35 kHz, the Z of the annealed samples increases with increasing in annealing temperature, and then decreases rapidly at 570 ℃. Interestingly, the Z of the annealed ribbons annealed at 550 ℃ exhibits a higher value in the frequency range of 35 kHz to 120 kHz, while the Z of the samples annealed at 570 ℃ has an advantage above 120 kHz. According to the Maxwell and Laudau-Lifshitz equations, the Z of the nanocrystalline ribbon can be expressed as:

δm is the skin depth related to magnetism, J0 and J1 are Bessel functions, Le is the self-inductance of the ribbon, μΦ is the permeability of the magnetic cores, l is the length of the ribbon, a is the radius of the ribbon, and RDC is DC resistance. The results indicate that the Z of nanocrystalline soft magnetic materials mainly depends on the permeability associated with the L, which is affected by microstructure and magnetic anisotropy [32-34]. Hence, at low frequencies, the microstructure mainly affects the magnetization mechanism of nanocrystalline soft magnetic materials, and optimal temperature annealing induced fine and uniformly distributed nano-grains achieve high Z. As the frequency increases, the magnetic anisotropy introduced by high-temperature annealing gradually dominates the magnetization process, which results in a higher Z.
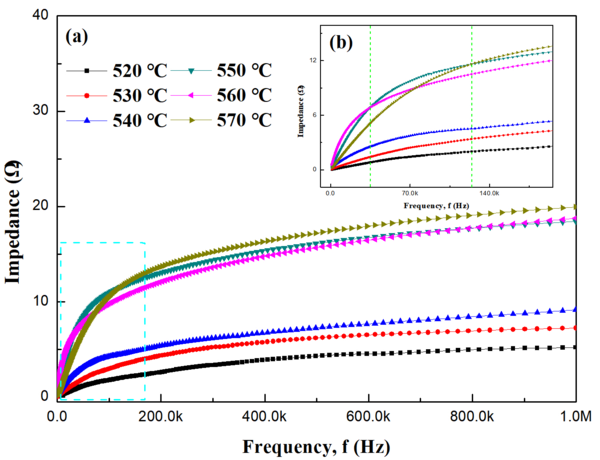
Fig. 9. (a) Impedance (Z) as a function of annealing temperature for the Fe73.5Si15.5B7Cu1Nb3 ribbon alloy ranging from 1 kHz to 1 MHz. (b) Inset of the partial amplified Z in certain frequency ranges.
3. Conclusion
In this work, the microstructure, magnetic structure evolution and magnetic characteristics of the Si-rich Finemet alloy have been systematically investigated. The Fe73.5Si15.5B7Cu1Nb3 amorphous alloy exhibits high amorphous forming ability and good thermal stability. The nanocrystallization mechanism of the Finemet amorphous alloy after annealing at optimum temperature are attributed to the mutual effect of chemical concentration fluctuations and heterogeneous nucleation, which promotes the formation of high volume fraction, fine, and uniformly distributed nanocrystalline structure, thereby resulting in good magnetic properties including high Ms of 135.4 emu/g and low Hc of 0.56 A/m, together with excellent low-frequency characteristics. Also, the optimal induced relaxation forms wide and straight regular magnetic domains, which leads to low pining effect. Furthermore, high-temperature annealing introduced appropriate anisotropy affects the magnetization process and changes the shape of the hysteresis loops, which effectively improves high frequency characteristics. Our findings provide guidance for high-performance nanocrystalline soft magnetic materials prepared by specific annealing processes at different frequencies.
Please take note that this article is already published in Science Direct. You may not use the content without permission.
NEWS
Wettbewerb erfolgreich beendet
2023-05-18
Kontakt
Tel : +86-20-37720102
Cell : +86-13392672318
Email : info@jchncores.com
WhatsApp : +86-15986765253
Adresse: No.18, Suida St. Huangpu District, Guangzhou
Website : www.jchncores.com
Copyright 2023 JCHN Cores


